The Dashboard
MaxTel's ncurses dashboard — panels, layout modes, and navigation
When you run MaxTel in interactive mode, you get a full-screen ncurses dashboard that shows you everything happening on your BBS at a glance. The display is divided into four panels, a header bar, and a status bar — and the whole thing adapts to your terminal size automatically.
Screen Layout
The dashboard is organized in a consistent arrangement:
- Header bar (top) — shows the MaxTel version, “Maximus Telnet Supervisor”, and the port you’re listening on
- User Stats (top left) — details about the user on the currently selected node
- System (top right) — BBS info and live statistics
- Nodes (bottom left) — status of every managed node
- Callers (bottom right) — recent caller history
- Status bar (bottom) — keyboard shortcuts and the current layout mode
User Stats Panel
This panel shows information about whoever is logged into the node you’ve selected in the Nodes panel. If nobody’s online on that node, it displays “(No user online)”.
| Field | What It Shows |
|---|---|
| Name | The user’s registered name |
| City | City and state/province |
| Calls | Lifetime call count |
| Msgs | Messages posted and read |
| Up/Dn | Kilobytes uploaded and downloaded |
| Files | Files uploaded and downloaded |
Select a different node (arrow keys or number keys) and this panel updates instantly.
System Panel
Gives you a snapshot of your BBS configuration and current activity.
| Field | What It Shows |
|---|---|
| BBS | System name from maximus.toml |
| Sysop | Sysop name from maximus.toml |
| FTN | FidoNet address (if configured) |
| Time | Current system time |
| Nodes | Total nodes configured |
| Online | How many have active users right now |
| Waiting | How many are sitting at WFC (Waiting For Caller) |
On wider terminals (100+ columns), the panel expands to also show uptime, peak simultaneous users, total user count, messages written, and files downloaded.
On compact terminals (80×25), there isn’t room for everything at once. The
System panel switches to a tabbed view — press Tab to flip between the
Info tab (BBS/Sysop/FTN) and the Stats tab (uptime, peaks, totals).
Nodes Panel
This is the heart of the dashboard — a live list of every node MaxTel is managing.
| Column | What It Shows |
|---|---|
| Node | Node number |
| Status | WFC (waiting), Online (active session), Starting, Stopping, or Inactive |
| User | The logged-in user’s name, “<waiting>” during login, or blank |
| Activity | What the user is currently doing (wider terminals only) |
| Time | Session duration in MM:SS |
The currently selected node is highlighted. Use ↑/↓ or number keys
(1–9) to change selection. If you have more nodes than fit on screen,
scroll indicators appear at the edges.
The selected node is also what the User Stats panel displays, and it’s the target for sysop commands like Kick and Snoop.
Callers Panel
Shows recent caller history so you can see who’s been connecting.
| Column | What It Shows |
|---|---|
| Node | Which node the call came in on |
| Calls | That user’s lifetime call count |
| Name | Caller name or alias |
| Date/Time | When they connected (medium+ terminals) |
| City | Where they’re from (full-width terminals) |
The panel title shows how many callers are displayed (e.g., “Last 8”), and the bottom border shows today’s total caller count.
Responsive Layouts
MaxTel detects your terminal size and picks the best layout automatically. If you resize the terminal window, it redraws on the fly — no restart needed.
Compact (80×25)
For standard-width terminals:
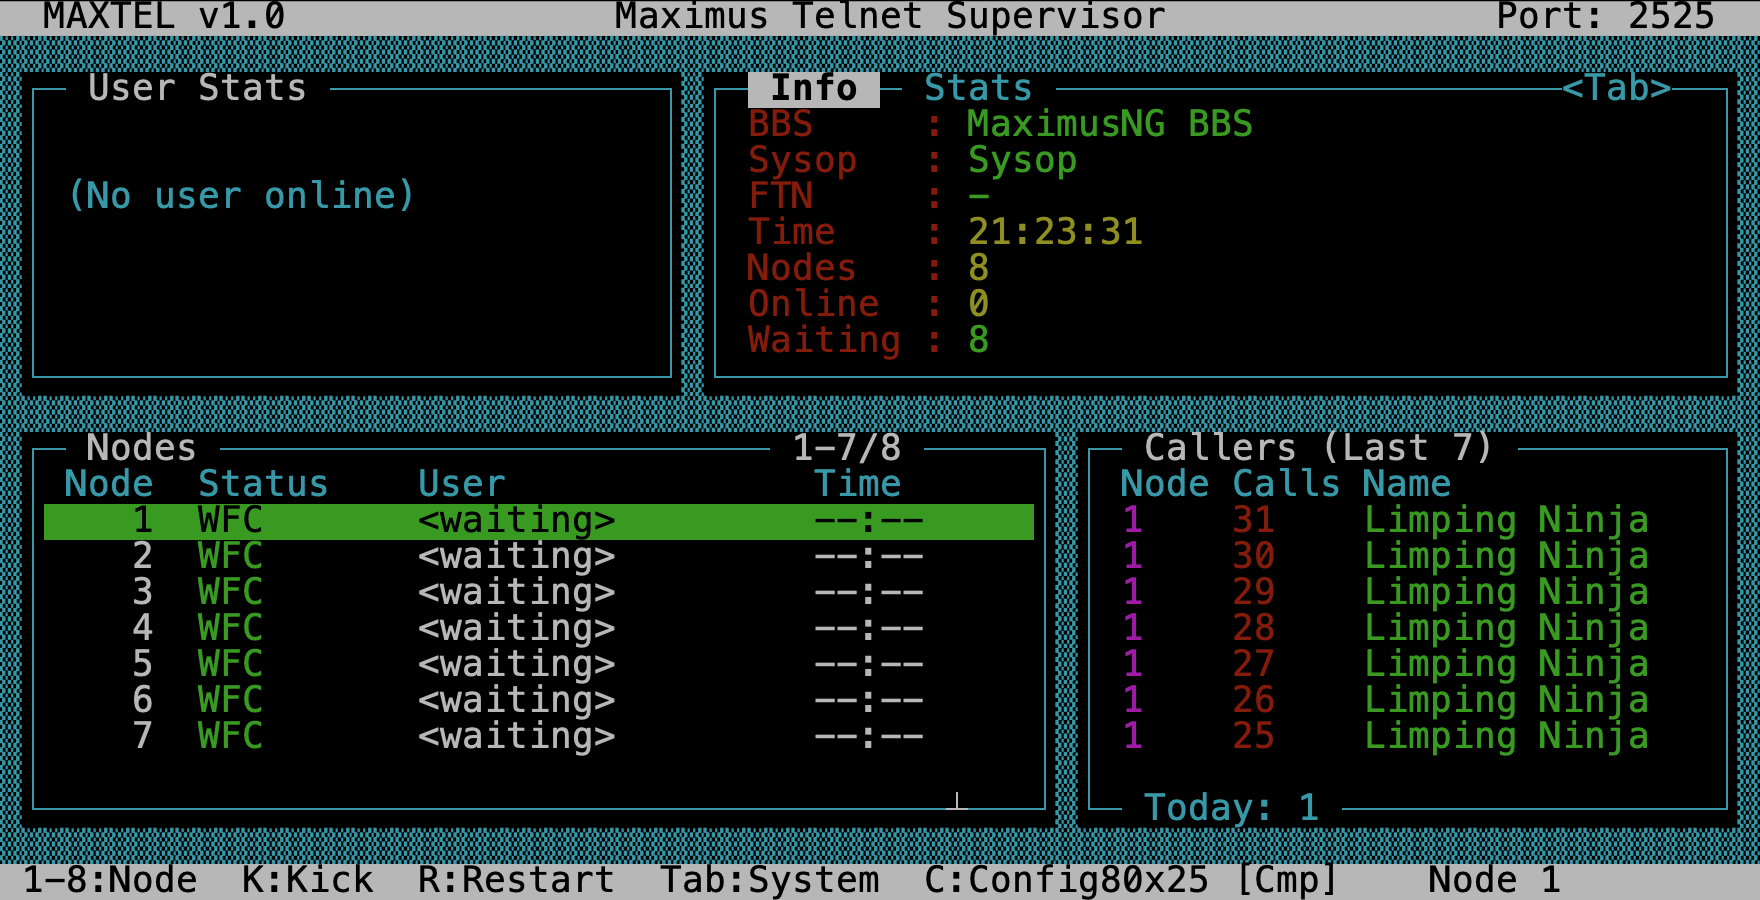
- System panel uses tabbed view —
Tabswitches between Info and Stats - Node list omits the Activity column
- Caller names truncated to 14 characters
- Status bar shows
[Cmp]
Medium (100×30+)
For wider terminals:
- System panel shows Info and Stats side by side
- Callers include date/time
- More room for full names
- Status bar shows
[Med]
Full (132×40+)
For large terminals:
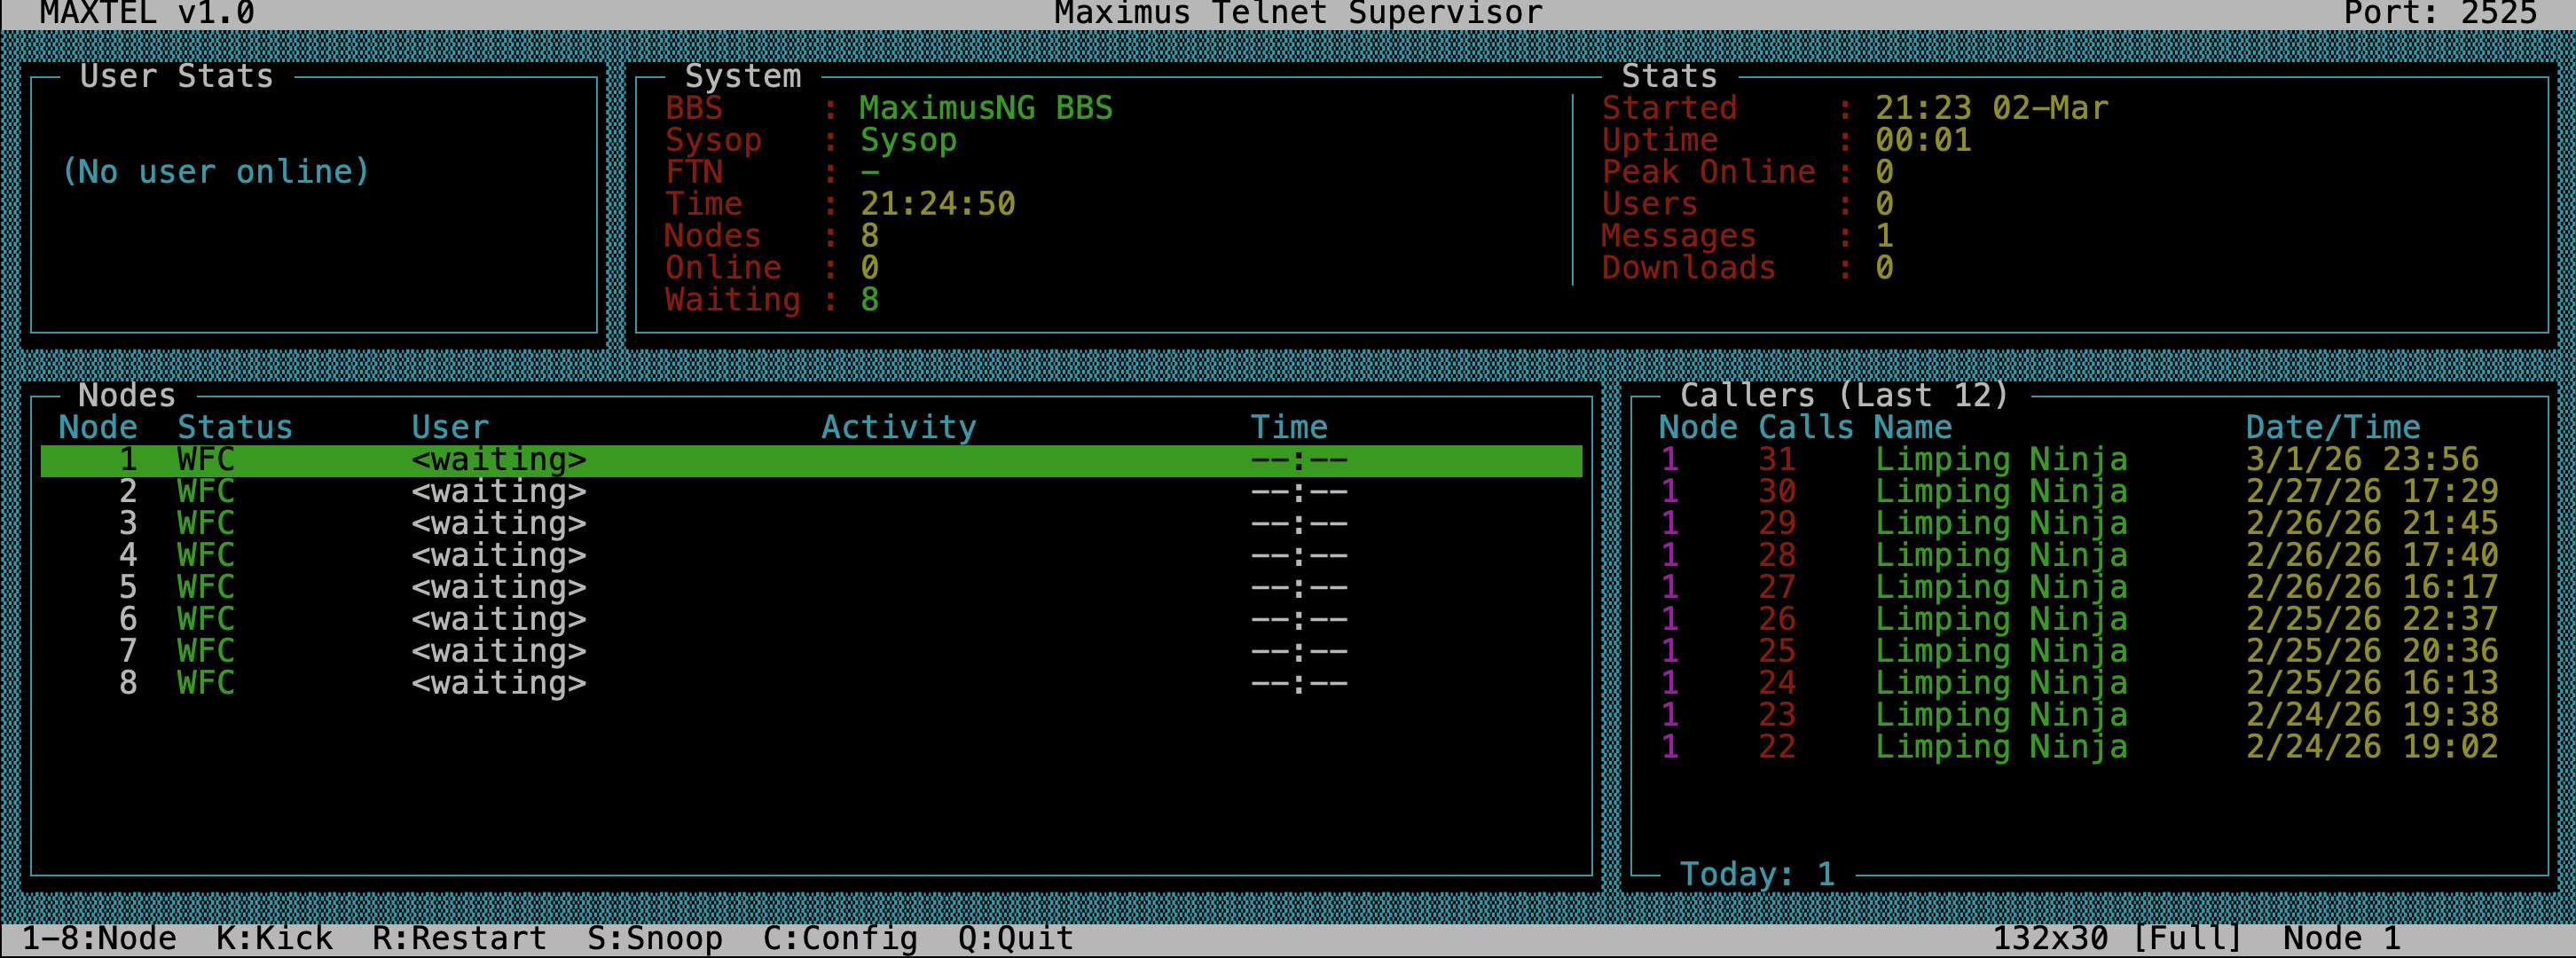
- Nodes panel includes the Activity column
- Callers show city information
- Everything displays at full length — no truncation
- More nodes and callers visible at once
- Status bar shows
[Full]
Tip: If you want a specific layout regardless of what your terminal reports, use the
-sflag when starting MaxTel:maxtel -s 132x60
Navigation Quick Reference
| Key | Action |
|---|---|
1–9 |
Jump to node 1–9 |
↑ ↓ |
Move node selection up/down |
Tab ← → |
Switch System panel tabs (compact mode) |
Q |
Quit MaxTel (shuts down all nodes gracefully) |
For sysop commands (Snoop, Kick, Restart, Config), see Sysop Features.
See Also
- MaxTel — overview, features, and getting started
- Running MaxTel — command-line options and operating modes
- Sysop Features — snoop, config, kick, and restart
- Troubleshooting — common problems and log files